htop 3.0.0: A Deep Dive into the New Features for Modern Linux Monitoring
htop 3.0.0: The Next Evolution in Linux Process Monitoring
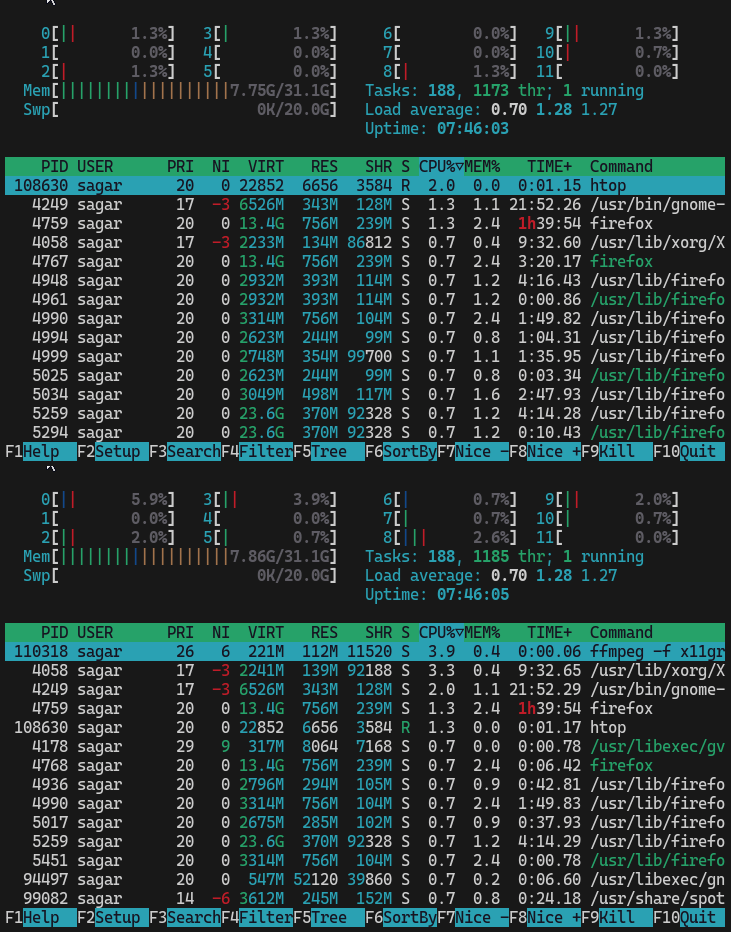
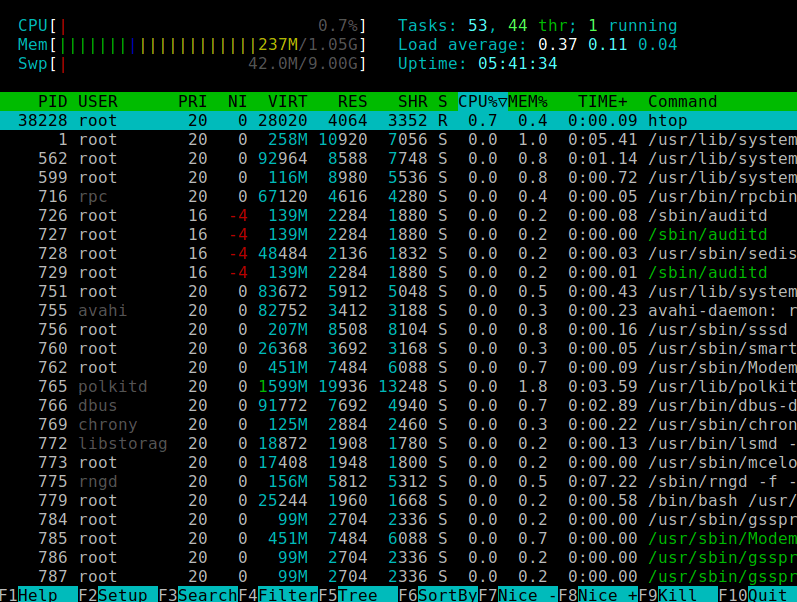
For years, htop has been the go-to interactive process viewer for Linux administrators, DevOps engineers, and power users alike. It took the classic top command and infused it with a user-friendly, color-coded interface, mouse support, and a wealth of customization options. It has become an indispensable tool for real-time system diagnostics across a vast landscape of distributions, from Ubuntu news and Debian news circles to the enterprise environments of Red Hat news and SUSE Linux news. Now, with the release of htop version 3.0.0, this essential utility takes another significant leap forward, introducing powerful new features tailored for the complexities of modern Linux systems.
This major update isn’t just an incremental patch; it delivers fundamental improvements that enhance both usability and diagnostic capabilities. The introduction of Pressure Stall Information (PSI) meters provides unprecedented insight into resource contention, a critical metric for today’s containerized and heavily loaded servers. Combined with significant user experience upgrades, htop 3.0.0 solidifies its position as a cornerstone of any Linux administration news toolkit, offering deeper visibility into everything from a simple Linux desktop running GNOME or KDE Plasma to a complex Kubernetes cluster. This article explores these new features in-depth, providing practical examples and best practices to help you leverage the full power of the latest htop.
Unveiling the Headliners: What’s New in htop 3.0.0
The latest release brings two game-changing features to the forefront: direct visibility into kernel-level resource pressure and a much-anticipated enhancement to its user interface. These additions address key pain points for users and reflect the evolving needs of system monitoring.
Pressure Stall Information (PSI): A Window into Resource Contention
Perhaps the most significant addition in htop 3.0.0 is support for Pressure Stall Information (PSI) meters. PSI is a feature introduced in Linux kernel 4.20 that provides a more accurate way to measure resource pressure. Instead of just knowing your CPU is at 90% utilization, PSI tells you how much time processes are actually spending stalled—waiting for CPU, memory, or I/O. This is a crucial distinction for Linux performance tuning.
htop now exposes these metrics directly in its meter display. You can add meters for:
- CPU Some: Shows the percentage of time in which at least one task is stalled waiting for a CPU core.
- Memory Some/Full: Indicates time spent waiting due to memory pressure, distinguishing between some tasks stalling and a situation where all non-idle tasks are stalled (thrashing).
- I/O Some/Full: Reveals time spent waiting for I/O operations to complete, a common bottleneck for database servers running on filesystems like ext4 or Btrfs.
This feature is a massive win for anyone involved in Linux troubleshooting, especially in environments using Docker Linux news or Proxmox news, where resource contention between containers or VMs can be subtle and difficult to diagnose with traditional metrics alone.
Enhanced User Experience with Full Mouse Wheel Support
While htop has long had basic mouse support for clicking on processes, version 3.0.0 introduces a feature users have requested for years: full mouse wheel support. You can now effortlessly scroll up and down the process list using your mouse wheel. This might seem like a small change, but for anyone managing a busy Linux server with hundreds or thousands of processes, it’s a monumental quality-of-life improvement. No more repetitive tapping of the arrow keys. This simple enhancement makes navigating complex process trees and long lists intuitive and fast, bringing the terminal-based tool closer to the fluidity of a modern GUI application.
Putting New Features into Practice: A Practical Guide
Understanding new features is one thing; applying them to solve real-world problems is another. Let’s explore how to configure and use htop 3.0.0’s capabilities for practical system administration and diagnostics.

Configuring and Interpreting PSI Meters
To get started with PSI, you first need to add the meters to your htop display.
1. Launch htop.
2. Press F2 to enter the Setup menu.
3. In the “Available Meters” column on the right, scroll down until you find the PSI meters (e.g., `PSI_some_cpu`, `PSI_full_io`).
4. Select a meter and press F5 or F6 to add it to your left or right columns.
5. Press F10 to save and exit.
Imagine your Nginx Linux news web server is feeling sluggish, but CPU and memory usage look normal. By looking at the `PSI_full_io` meter, you might see it spiking at 20%. This tells you that for 20% of the time, all tasks are stalled waiting on disk I/O. This immediately points your investigation towards a slow disk, a misconfigured PostgreSQL Linux news database, or an overloaded NFS share, problems that traditional metrics might not have revealed so clearly.
You can save this configuration permanently. Your settings are stored in ~/.config/htop/htoprc. Here is an example configuration file that enables PSI meters and sets a custom color scheme.
# Example htoprc for htop 3.0.0
# Located at ~/.config/htop/htoprc
# Fields for the process list
fields=0 48 47 46 17 18 38 39 40 2 49 50 51 1
# Meters configuration
left_meters=AllCPUs Memory Swap
right_meters=Tasks LoadAverage Uptime PSI_some_cpu PSI_full_io
# Options
tree_view=0
hide_threads=0
hide_kernel_threads=1
hide_userland_threads=0
shadow_other_users=0
show_thread_names=0
show_program_path=1
highlight_base_name=0
highlight_megabytes=1
highlight_threads=1
detailed_cpu_time=0
cpu_count_from_one=0
update_process_names=0
color_scheme=5
delay=15
left_meter_modes=1 1 1
right_meter_modes=2 2 2 2 2
This configuration file can be managed and deployed using Linux configuration management tools like Ansible news or Puppet, ensuring a consistent monitoring view across all your servers.
Advanced htop Techniques for Power Users
Beyond the new features, htop contains a wealth of advanced functionality that can streamline your workflow. Mastering these techniques can turn htop from a simple viewer into a powerful diagnostic and management tool.
Filtering, Searching, and Tagging Processes
On a system running hundreds of processes for different users and services, finding what you need is key. htop provides several powerful ways to do this:
- Filter (F4): Press F4 and type a string. The process list will instantly update to show only lines containing that string. This is perfect for isolating all processes related to a specific application, like `apache2` or `cron`.
- Search (/): Similar to filtering, but it simply jumps to and highlights the next matching process name without hiding others.
- User Filter (U): Press ‘U’ and select a user from the list to see only their processes. This is invaluable on multi-user systems.
- Tagging (Spacebar): You can select multiple, disparate processes by highlighting them and pressing the spacebar. Once tagged, you can press F9 to send a signal (like KILL or TERM) to all of them at once. This is useful for cleaning up a misbehaving application and all its child processes.
For example, to quickly start htop and see only the processes for the `www-data` user, you can use a command-line flag.
# Start htop showing only processes for the 'www-data' user
htop -u www-data
Using htop in Batch Mode for Scripting
While htop is designed to be interactive, it also includes a non-interactive “batch mode” that is incredibly useful for Linux automation and Linux shell scripting. By using the -b flag, htop will print its output to standard out and then exit, allowing you to pipe it to other commands like grep, sed, or awk for analysis or logging.

This opens up many possibilities for system monitoring scripts. For instance, you could create a simple script that logs high-CPU processes for later review.
#!/bin/bash
# A simple script to log processes using more than 75% CPU.
# This is a conceptual example; for production, use proper monitoring tools.

LOG_FILE="/var/log/high_cpu_alerts.log"
CPU_THRESHOLD=75.0

# Use htop in batch mode for one iteration (-n 1), then process with awk.
# The `tail -n +2` command skips the htop header lines.
htop -b -n 1 | tail -n +2 | awk -v threshold="$CPU_THRESHOLD" '
{
    # In default htop output, column 3 is typically %CPU
    if ($3 > threshold) {
        # Prepend a timestamp and log the entire line
        print strftime("[%Y-%m-%d %H:%M:%S]"), "High CPU:", $0;
    }
}
' >> "$LOG_FILE"
This technique can be integrated into cron jobs or Linux systemd timers news to create a lightweight, custom monitoring solution, providing valuable data for Linux forensics or incident response.
Best Practices and Optimization
To get the most out of htop, it’s important to use it effectively and understand its place within the broader ecosystem of Linux monitoring tools.
Context is King: When to Use htop
htop excels at providing an immediate, real-time snapshot of what’s happening on a system *right now*. It’s the perfect tool for ad-hoc investigation when you notice a problem. However, it is not a replacement for a long-term monitoring and observability stack. For tracking trends over time, setting up complex alerts, and aggregating data from multiple hosts, tools from the Linux observability news space like Prometheus, Grafana, and the ELK Stack are more appropriate. Use htop to diagnose the “why” when your Prometheus alert fires, not as the alerting system itself.
Security and Performance Considerations
Running htop as a regular user will only show you your own processes. To get a full system view, you must run it with sudo or as root. While necessary for full diagnostics, always exercise caution when running any command with elevated privileges. From a security perspective, htop can be a useful tool for spotting anomalous processes that might indicate a compromise, making it a valuable part of any Linux security news toolkit.
Regarding performance, htop itself is incredibly lightweight. However, setting the refresh interval (the “delay” in the setup menu) to be very short on a heavily loaded system can add a small amount of overhead. The default of 1.5 seconds is sensible for most use cases.
Conclusion: The Future of System Monitoring
The release of htop 3.0.0 marks a significant milestone for this beloved open-source utility. By incorporating modern kernel features like Pressure Stall Information and improving core usability with full mouse support, it has adapted to meet the challenges of contemporary system administration. These enhancements ensure that htop remains a vital, relevant tool for anyone working with Linux, whether on a developer laptop running Arch Linux news or a fleet of cloud servers in AWS Linux news.
The key takeaway is that htop is more powerful than ever for answering the critical question: “What is my system doing right now?” The next step for all Linux users is to update to the latest version. On most distributions, this is as simple as running sudo apt update && sudo apt upgrade, sudo dnf upgrade, or sudo pacman -Syu. Dive in, configure the new PSI meters, and enjoy the seamless scrolling. Your future troubleshooting sessions will thank you for it.


